
Analysts don’t like the “why” questions. They are tough to answer. For instance, in a help desk analysis, it is easy to show which tickets are resolved faster. But it is difficult to say why. In my practice in Sopra Steria I found that one tool is especially robust to deal with practical “why” questions: the Chi-Square test for independence.
Answering the “why”: the traditional way
Even for a statistician, it is not immediately clear how a Chi-Square test (which I will cover later) could help to answer the “why” questions. To demonstrate how I use it, I need to first explain the alternative way. Here is an example.
I want to know why some help desk tickets take long time, while some others take short time. This is depicted in the histogram below. I am interested in the spike peak (a spike, a hump) to the very left, representing a group of tasks that are being solved below 1 minute, which is surprisingly quick. I want to know why.
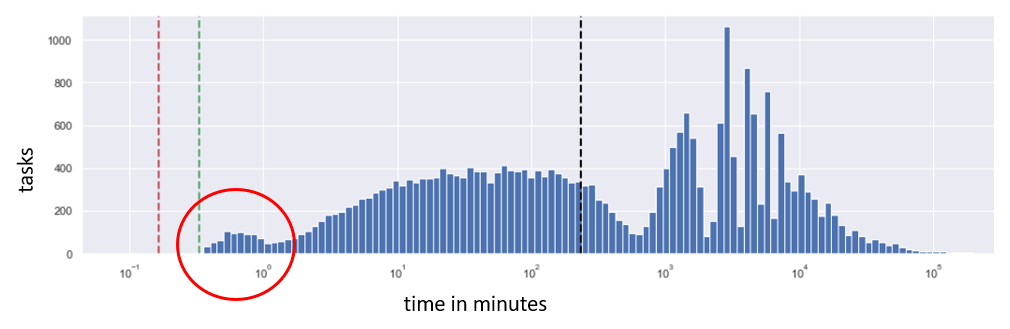
To discover the reason for that peak, I should divide the data into two sets: records within the peak (blue below), and all the remaining records (orange below). Then I will test some ideas that come to mind. Perhaps some agents (service desk employees) solve problems quicker, because they are more experienced or more effective? Let’s visualize the distribution of tasks sorted by the agent name within the peak, and outside the peak:
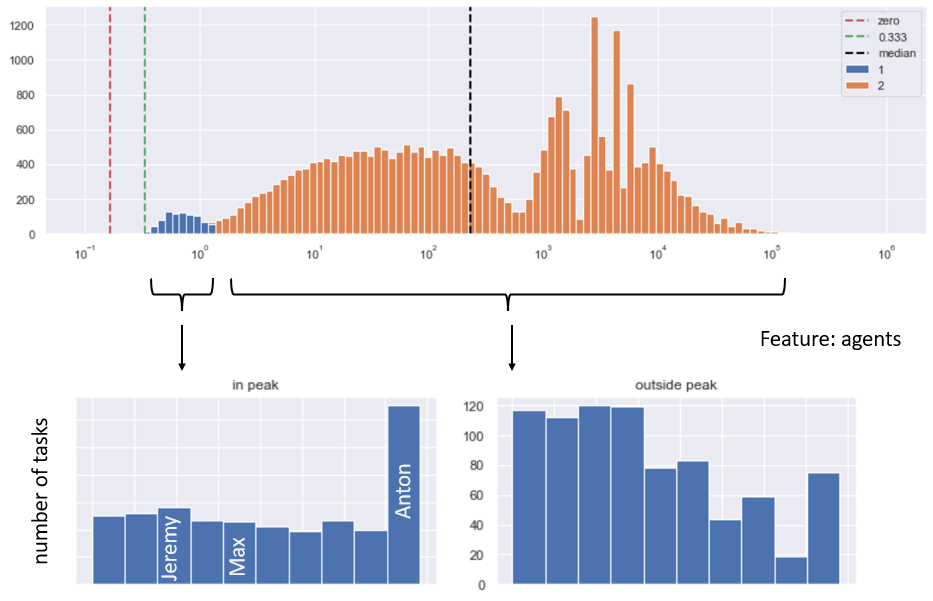
The outcome is interesting. When it comes to the number of tasks closed below 1 minute, the agent Anton is clearly the leader. This way we quickly identified a hint, which can lead to the potential reason for the peak in data.
Why the traditional way does not work
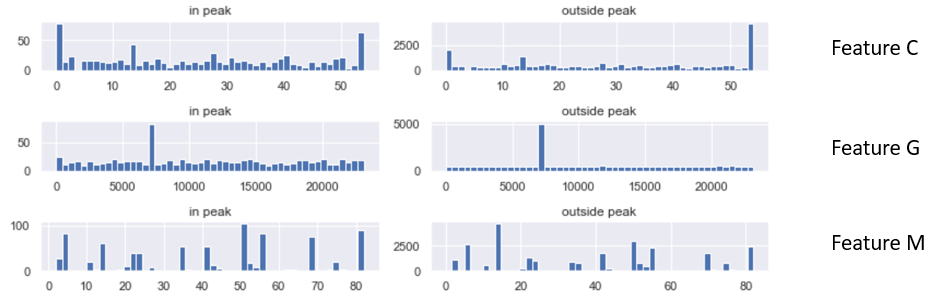
Unfortunately in real life, such reasoning is not that easy. The “agent name” is an example of the data feature. The real data will have hundreds of features. Each of those features will have hundreds or thousands of possible values. Guessing which feature is responsible for the peak is tedious and impractical. One would need to browse through hundreds of charts looking like this:
And here is where the Chi-Square test for independence (also known as chi2, described in the previous article) can shine. Here is rendering of a Jupyter notebook demonstrating the power of chi2 on a different example.
The reason I use Jupyter notebooks is that the technical readers can read the source code to know exactly what I was doing. Non-technical readers can simply skip the source code sections, and still understand the concept.
So what makes up the spike?
First let’s initiate some environment and read the data.
import pandas as pd, numpy as np, chi2_util, loghist # https://github.com/altanova/stuff
import matplotlib.pyplot as plt, seaborn as sns
from sklearn.preprocessing import LabelEncoder
sns.set()
df = pd.read_csv("sample.csv")
And here is our case. Below is a histogram, representing the volume of tickets resolved in time. The x axis, representing time, is logarithmic. There is a clear spike showing that abnormally high amount of tickets is being resolved in 6 days. We are interested to find out why.
# this field represents minutes
df['minutes'] = df['G']
fig, ax = plt.subplots(1,1, figsize = (15,3))
loghist.lhist(xticks = 'minutes',axis = ax, df = df, field = 'G', annotate = 'statistics')
plt.tight_layout()
plt.show()

First, let’s group the data into group 0 (outside the spike) and group 1 (inside the spike, which happen to be between 143.5 and 148 hours). Let’s color the groups, to visually ensure that we did this correctly:
# G represents minutes
df['hours'] = df.minutes / 60
df['group'] = df.apply(lambda r: (r.hours >= 143.5) & (r.hours <= 148), axis = 1)
df['group'] = df['group'].astype(int)
fig, ax = plt.subplots(1,1, figsize = (15,3))
loghist.lhist(xticks = 'minutes',axis = ax, df = df, field = 'minutes', annotate = 'statistics',
              group_field = 'group')
plt.tight_layout()
plt.show()

Nice! Our grouping looks correct: the orange tickets (group 1) indeed fit in the spike.
Next, we want to understand which feature is responsible for the spike. Our data has about 300 features, named A, B, C and so on. So, which of those features is responsible for the spike?
Going manually through all the features would cost days of work. Instead, we can use the chi square test for independence . This is a statistical procedure that tells us which feature shows the most striking difference in their distribution within the spike and outside the spike. Here is how it works.
We first need to prepare (encode) the data.
orig = df.copy()
features = ['A', 'B', 'C', 'D', 'E', 'F', 'H', 'I', 'J']
dfcn = df[features].fillna('EMPTY')
dfce = dfcn.apply(LabelEncoder().fit_transform)
dfchi = dfce.merge(orig['group'],
           left_index = True,
           right_index = True,
           how = 'inner')
We are now ready to run the chi2 test. The meaning of the test is: “tell us which feature (column) of the data has different values within spike and outside the spike.”
# run chi2. For technical details, see the previous articles on ondata.blog,
# or https://github.com/altanova/stuff
chi2_util.chi2_score(dfchi,
                     features =  features,
                     target = 'group',
                     alpha = 0.05,
                     deep = True,
                    verbose = False)[:3]
| chi2 | critical | dof | p | rank | reverse_rank | |
|---|---|---|---|---|---|---|
| J | 3803.723333 | 21.026070 | 12.0 | 0.000000e+00 | 180.905103 | 0.005528 |
| C | 3855.023536 | 83.675261 | 64.0 | 0.000000e+00 | 46.071246 | 0.021706 |
| H | 996.933832 | 368.041582 | 325.0 | 2.352720e-69 | 2.708753 | 0.369174 |
Above, the chi2 test gave us the top 3 suspects. At the very top of the list os the feature J.
Business meaning: the anonymized feature J represents the label, which the task receives right after it arrived in the service desk. This would imply that the spike contains tasks with particular labels. Which ones? Let’s build a quick pivot table showing the distribution of feature J values outside the spike (column 0) and within the spike (column 1).
piv = df.pivot_table(columns = 'group',
               index = 'J',   # feature that interests us
               values = 'A',  # any feature
               aggfunc = len).sort_values(by = 1, ascending = False)
piv[:5]
| group | 0 | 1 |
|---|---|---|
| J | ||
| 4 | 1402.0 | 790.0 |
| 10 | 9648.0 | 85.0 |
| 3 | 397.0 | 9.0 |
| 12 | 58.0 | 3.0 |
| 11 | 71.0 | 2.0 |
Interestingly, within the spike the feature J has mostly value 4.
Business interpretation: the anonymized value 4 represents the label “duplicate”. Looks like we found something interesting!
As last step, let’s visualize our discovery. How many duplicated tickets are there, and where are they generally located along the dimension of time? I mean not just within the spike, but throughout the entire set?
# hypothesis: the reason for the spike is the 'phased out' code.
top_values = piv.index[0:1].tolist()
df['reason'] = df.apply(lambda r: int(r['J']) in top_values, axis = 1)
fig, ax = plt.subplots(1,1, figsize = (15,4))
loghist.lhist(xticks = 'minutes',axis = ax, df = df, field = 'minutes', annotate = 'statistics',
              group_field = 'reason')
plt.tight_layout()
plt.show()

Nice! the visualization seems to confirm the tentative conclusion we just formulated: the spike is indeed correlated with the feature “code”, value “duplicated”. We found a very strong hint, that could lead us to comprehend the factual reason for the spike
Summary
The Chi-Square test does not directly answer the why question, but it provides hints speeding the reasoning.
In our case, we found the following hint: the spike consists mainly of tickets, whose “code” field has value “duplicate”. What does this really mean?
The business interpretation may be as follows. Certain tasks are marked duplicate very early in their lifetime. Then, after a certain retention period of inactivity, an automatic process transfers tasks to the closed state. So in fact, we are not seing a spike in activity after 6 days, but a disproportional number of fake tasks that are automatically closed after 6 days. Quite an important insight for the business owner of the project.
With the help of chi2 test, this conclusion could be reached quickly. We could efficiently establish the feature that correlated with the spike: the task code. Remember it was one of 300 possible choices. An example of another possible choice (feature), mentioned earlier in the article, would be the agent name. This time however, if we tried to see which agent is responsible for the spike, we would fail because the spike was simply not related to that feature. We would then need to repeat the same for 100+ other features, wasting hours of work. The chi2 test made this quicker.
Notes and credits
Final note: the reasoning above is simplified. The chi square test is not universal. It only works on categorical features, on certain conditions. Also, it is part of a larger family of statistical tests for independence, not to be discussed here. To read more: [don’t trust the data], [unmasking data in camouflage], [isolating the spikes]. The subject is quite broad. The goal of this material is to demonstrate how an advanced statistical tool, such as the chi square test for independence, can be used to efficiently address a practical problem.
Credits: creating this material was possible thanks to my Data Science work for Sopra Steria. We always look for talent. If interested, [click here to contact our recruitment].