In Sopra Steria we manage the IT infrastructure and applications of big clients. We process millions of service tickets and infrastructure events. This massive stream of data comes from monitoring tools such as Zabbix, Nagios, Solarwinds, and higher level frameworks:
Data Puzzle
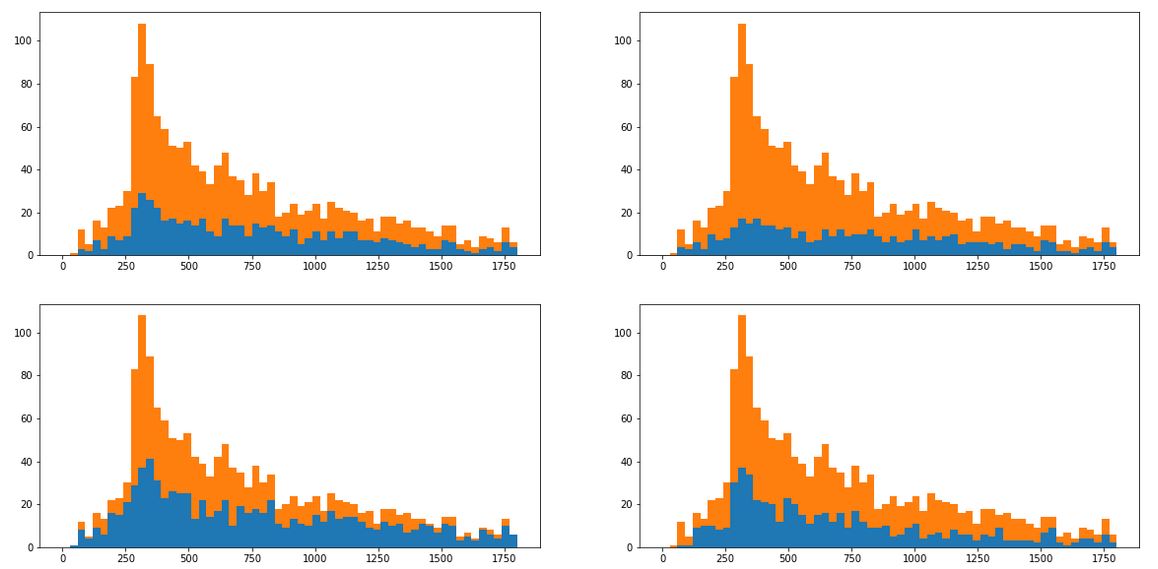
Here is a new data puzzle, coming from my recent analytics in Sopra Steria. I will describe the problem, but not the answer. If you like the challenge, please contribute your thoughts in the comments. The title of the data
A picture worth 1,000 words
I love mountains. Some of my dear ones say that this is only because they resemble histograms, which I love more. Not true (ha ha), but I must agree that visualizations done properly brings plenty of satisfaction. Histograms, when prepared
3 Steps to Unmask Data in Camouflage
I am looking at distribution of a certain data set (left). It has two peaks (this is called ‘bimodal’) therefore I suspect that those are two overimposed populations. How do I split the data, to rediscover the original two populations
The truth behind a histogram dent
Here is quite intriguing research with the data of our Sopra Steria IT operations (ITSM, AIOps, and Infrastructure Management). I’ve been faced with an interesting situation in an IT Applications Management project for a large corporate client. In such a
How to isolate data that constitutes a spike in histogram?

We would all love to spot business problems early on, to react before they become painful. You can learn a lot by looking at past problems. Hence, understanding the nature of anomalies in data can bring substantial operational benefits and
